
| M | G | Q | I |
| Earnings Momentum | Growth | Quality | Institutional Ownership |
1. The Beginning: A Sector Entering a Structural Opportunity
The initial attraction to Waaree Energies was not simply its recent earnings growth. It was the broader opportunity developing around solar manufacturing and India's energy transition.
The investment question was not simply whether solar was a good sector. It was which companies were capable of converting the structural opportunity into sustained earnings growth.
2. M — Earnings Momentum
Within MGQI, Momentum refers specifically to earnings-growth momentum. The Waaree case is compelling because earnings did not merely grow; the scale and trajectory of earnings changed dramatically.
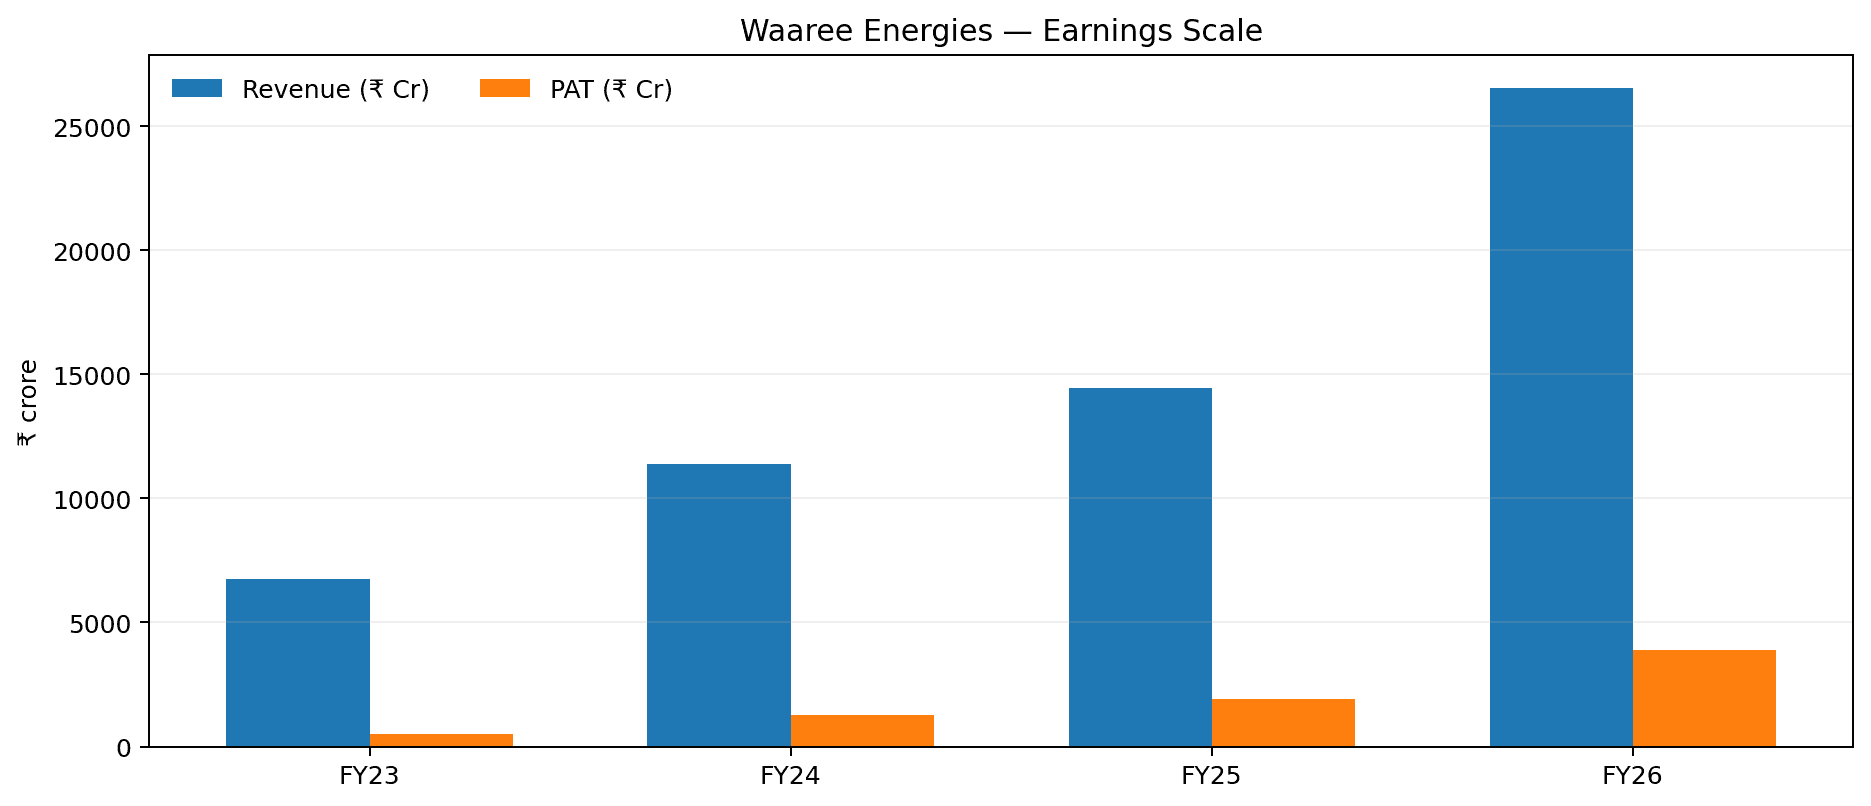
Revenue rose from ₹6,751 Cr in FY23 to ₹26,537 Cr in FY26, while PAT rose from ₹500 Cr to ₹3,884 Cr. FY26 PAT growth was approximately 101% year-on-year.
The key MGQI observation is the renewed acceleration in earnings after the moderation seen in FY25.
Growth asks: “Is the business growing?” Momentum asks: “Is the earnings trajectory strengthening or accelerating?” Waaree provides a strong illustration of that distinction.
3. Growth Was Being Supported by Capacity Expansion
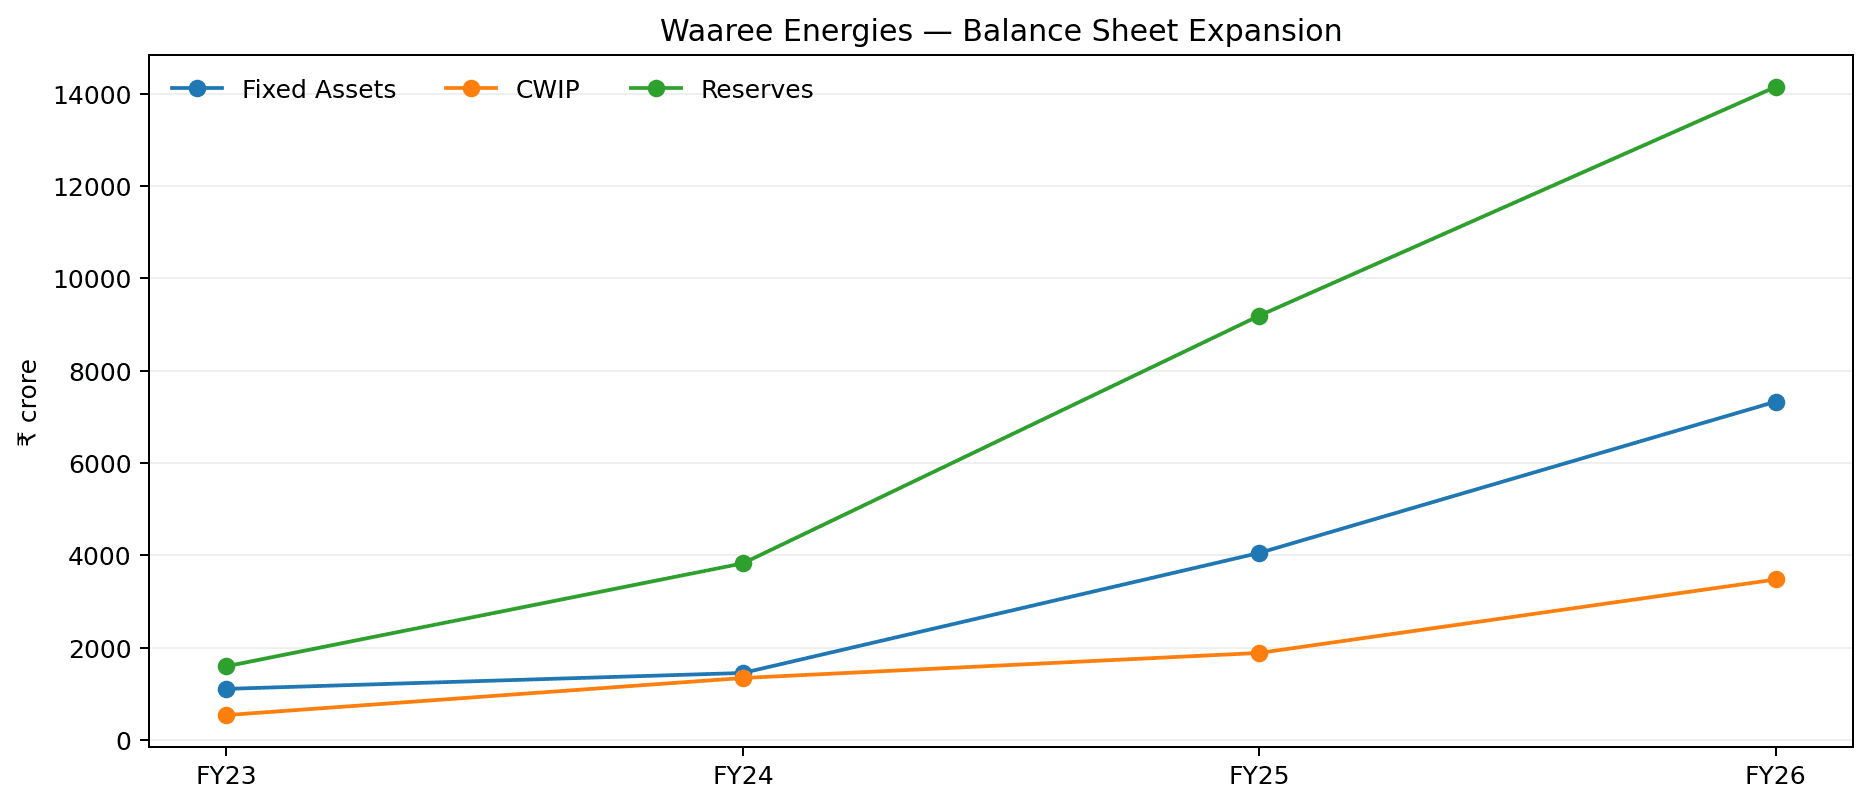
- Fixed assets increased from ₹4,051 Cr in FY25 to ₹7,329 Cr in FY26.
- CWIP increased from ₹1,884 Cr to ₹3,476 Cr.
- Reserves increased from ₹9,192 Cr to ₹14,150 Cr.
- Borrowings increased from ₹1,199 Cr to ₹3,213 Cr.
The earnings acceleration was occurring alongside significant expansion of productive capacity. The investment question therefore became whether today's capital deployment could create a sufficiently large future earnings base.
4. Quality — Growth With an Expanding Business Platform
Rapid growth alone is not enough. Waaree's expanding manufacturing platform, scale and integration provide the basis for assessing whether growth can become durable economic value.
At the same time, rapid capacity expansion introduces capital-intensity and execution risks. Utilisation, margins, returns on incremental capital and the ability to convert capacity into cash generation therefore remain important monitoring variables.
5. Cash Flow — Strong Operating Generation, Heavy Reinvestment
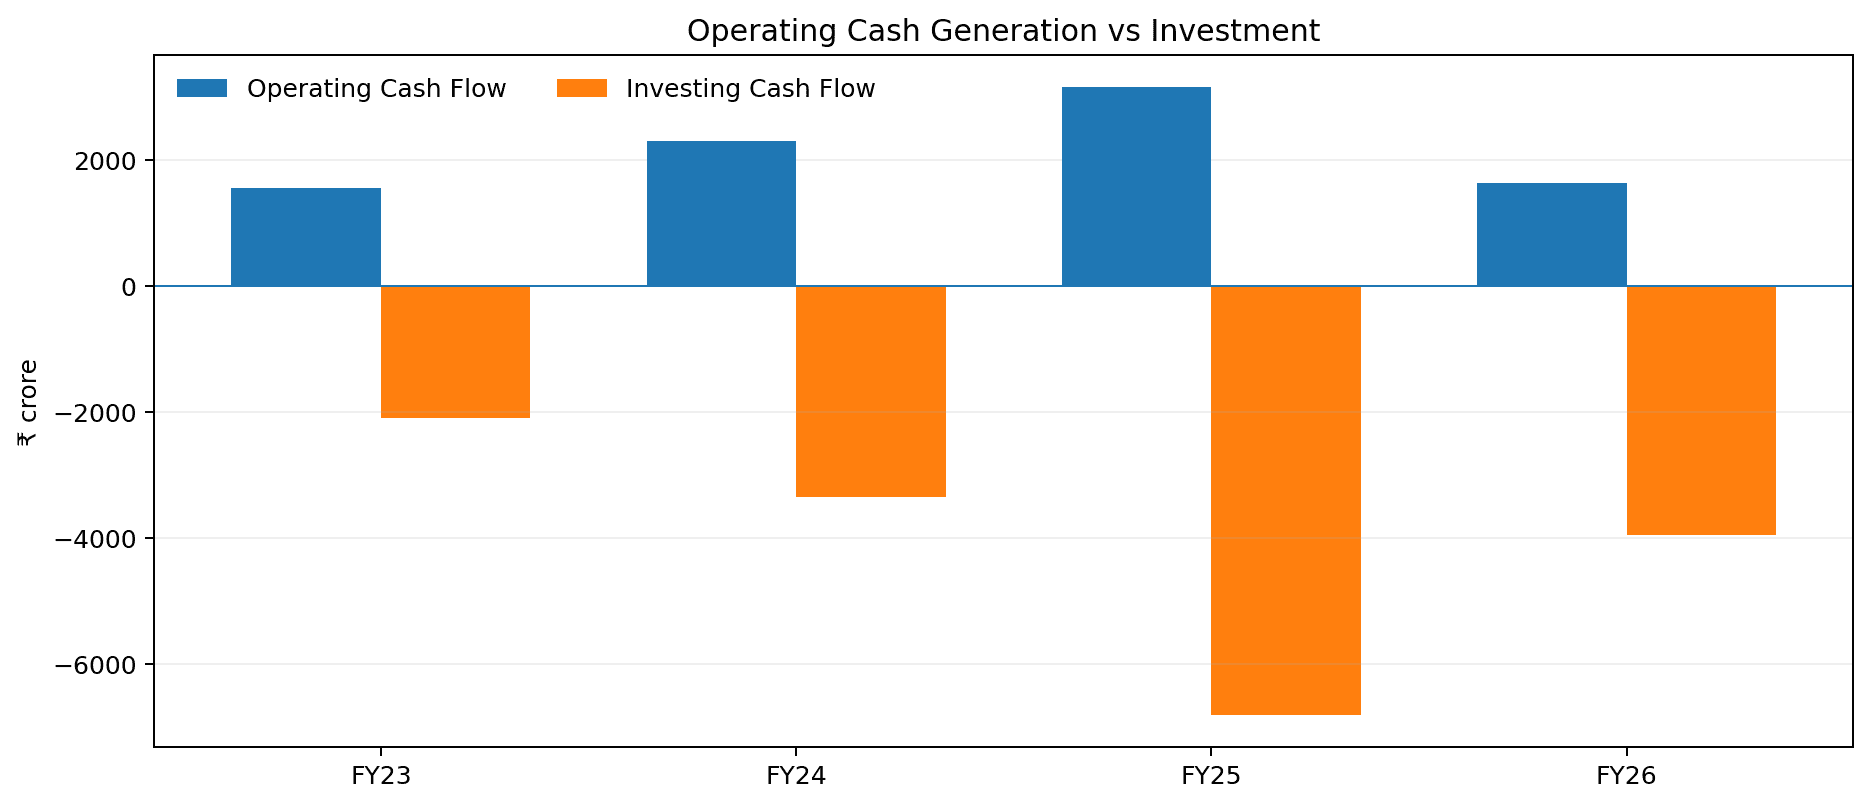
FY26 operating cash flow was approximately ₹1,627 Cr, while investing cash flow was approximately –₹3,953 Cr. Free cash flow was approximately –₹3,209 Cr.
Negative free cash flow should not be ignored. In context, however, it coincided with a substantial investment cycle. The key question is whether the capital being deployed today generates sufficient future earnings and cash flows.
6. Institutional Ownership — I Enters the Picture
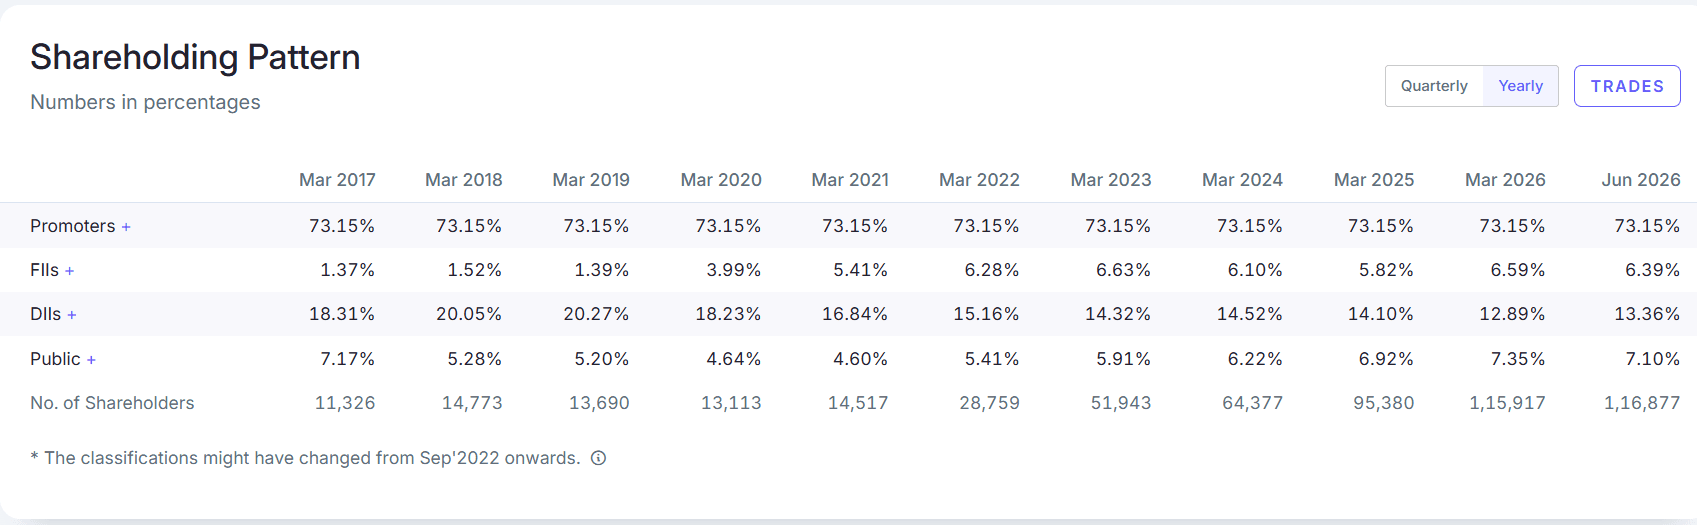
The supplied shareholding data show FII ownership rising from 0.70% in Mar 2025 to 8.57% in Jun 2026, while DII ownership rose from 2.46% to 4.08%. Promoter ownership remained broadly stable at about 64%.
Institutional participation is therefore an additional confirming signal, although the investment thesis does not depend on institutions being right. The MGQI interpretation is that improving fundamentals are attracting increasingly sophisticated capital.
7. The Valuation Paradox
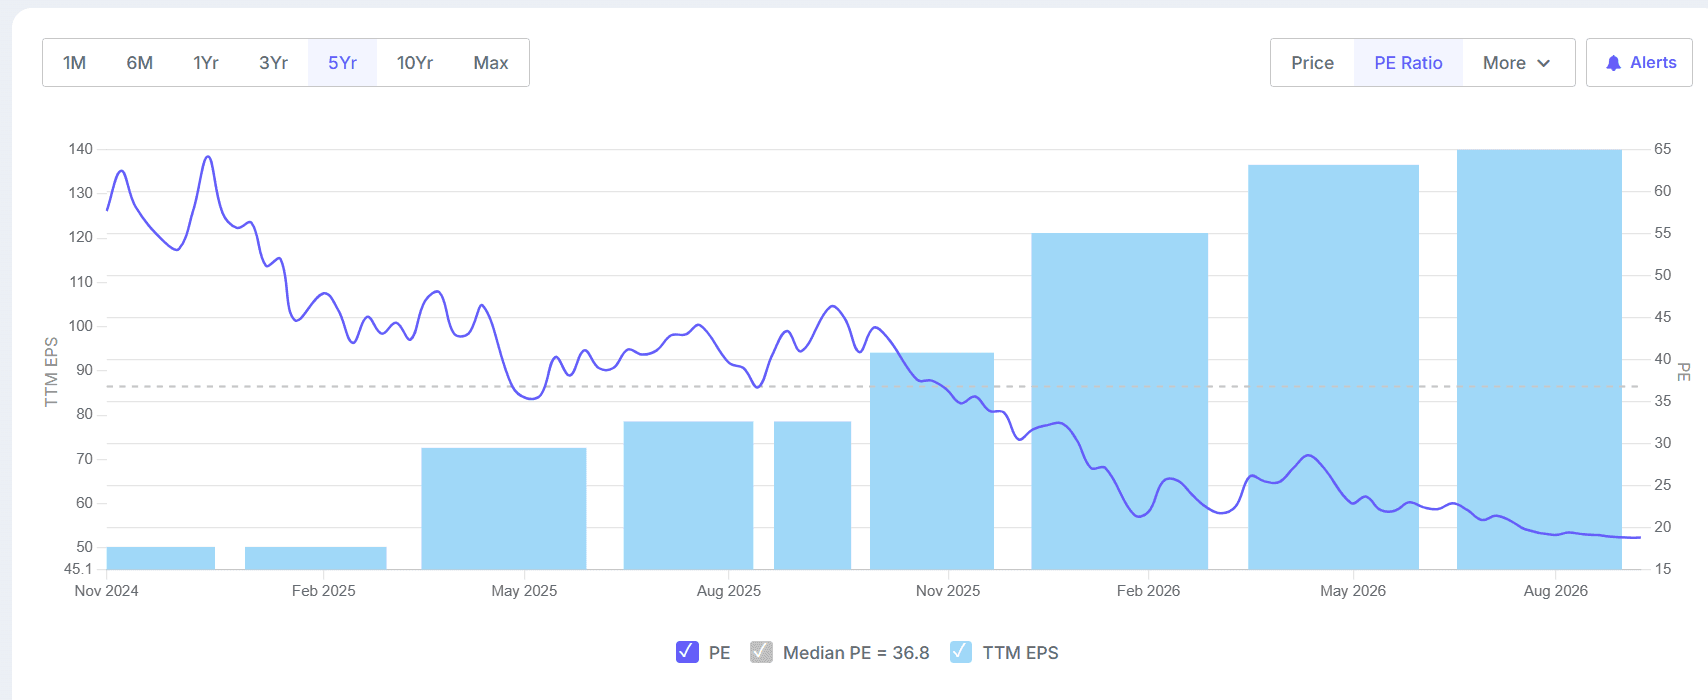
The valuation chart creates an unusually interesting risk–reward question. TTM EPS expanded dramatically while the P/E multiple compressed toward the low-20s on the supplied chart.
The important point is not that Waaree was simply cheap. It is that earnings growth materially changed the denominator while the valuation multiple contracted.
This can improve the asymmetry of the investment case, but multiple expansion should never be assumed. Continued earnings delivery remains the primary requirement.
8. The Technical Layer — When Does the Business Deserve Capital?
Fundamental analysis answers: “What deserves to be on the watchlist?” MGQI has another question: “When does it deserve capital?” This is where Relative Strength, Price and Volume enter.
Relative Strength
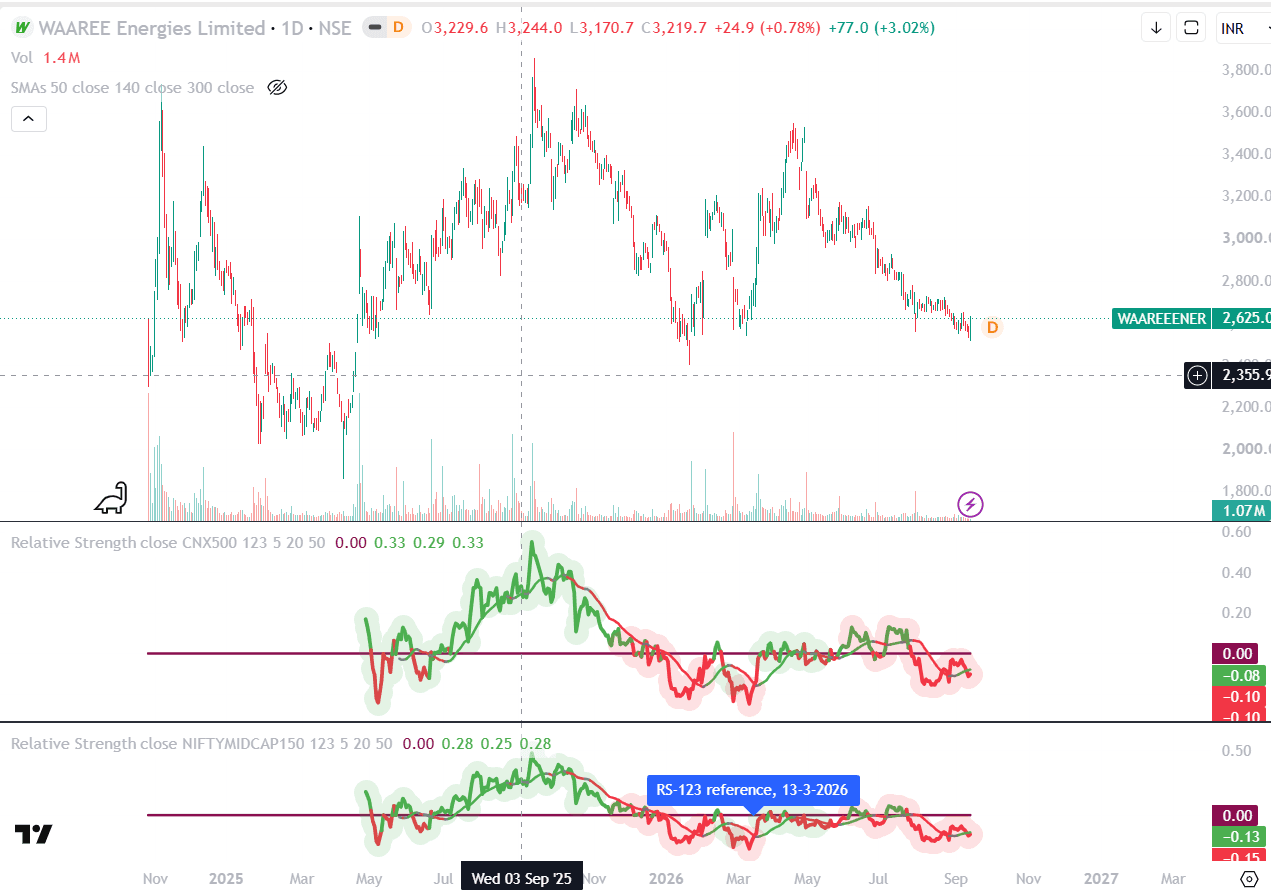
The chart compares Waaree's relative performance against CNX500 and NIFTY Midcap 150. This helps distinguish absolute price movement from performance relative to the relevant market universe.
Price
The stock has experienced substantial advances and sharp corrections. The appropriate MGQI approach is not to treat every correction as a thesis failure, but to interpret price structure alongside the fundamental evidence.
Volume
A particularly interesting feature is that several sharp corrections were accompanied by pronounced contraction in volume. This is different from a correction accompanied by persistent volume expansion.
The evidence should not be overstated as proof of “no distribution” because volume alone cannot establish that. A more defensible interpretation is that the corrections were not consistently accompanied by sustained high-volume selling pressure.
This is precisely how the technical layer should function: not as a prediction engine, but as a market-confirmation tool for capital deployment.
9. From Research to a Probe Position
Even after the sector opportunity, earnings momentum, growth, quality, institutional participation and valuation dynamics became attractive, uncertainty remained. Waaree was a relatively new listed company undergoing rapid expansion in a cyclical and competitive industry.
The response was a PROBE POSITION.
A probe position allows participation while conviction is still developing. When evidence is compelling but incomplete, start small and allow subsequent evidence to determine whether capital should increase.
The initial position is therefore not the conclusion of the analysis. It is the beginning of the feedback loop.
10. Why This Is Different From Chasing Momentum
MGQI does not begin with a rising price and work backward. The sequence is fundamentally different:
- Sector opportunity
- Business analysis
- Earnings momentum
- Growth and quality assessment
- Institutional participation
- Valuation assessment
- Market confirmation through RS, Price and Volume
- Probe position
- Observe further evidence
- Increase / maintain / reduce capital
The price is therefore one component of the confirmation process, not the starting point.
11. The MGQI Convergence
| MGQI Lens | Waaree Evidence |
|---|---|
| M — Momentum | Exceptional acceleration in earnings and EPS. |
| G — Growth | Structural solar opportunity combined with aggressive capacity expansion. |
| Q — Quality | Scale, integration, profitability and expanding business platform, balanced against capital intensity and execution risk. |
| I — Institutional Ownership | Material increase in FII and DII participation, while promoter ownership remained broadly stable. |
| RS / Price / Volume | Market confirmation through relative strength, price structure and the character of corrections. |
| Valuation | Earnings and EPS expanded while the P/E multiple compressed materially. |
The investment case did not depend on one attractive metric. It strengthened as multiple independent pieces of evidence began to converge.
12. What Could Still Go Wrong?
- Execution risk in large-scale capacity expansion
- Capital intensity and returns on incremental capital
- Industry cyclicality, oversupply and pricing pressure
- Competitive intensity
- Valuation compression despite earnings growth
- Sustainability of exceptional earnings growth
- Sharp market drawdowns and small-/mid-cap volatility
13. What Would Make Us Change Our View?
A serious thesis should define what would invalidate it. For Waaree, important warning signals would include:
- Sustained deterioration in earnings growth
- Material margin compression without a convincing strategic explanation
- Poor execution or delayed capacity commissioning
- Weak returns on incremental capital
- Structural deterioration in the solar manufacturing opportunity
- Persistent deterioration in Relative Strength
- Heavy distribution accompanied by deteriorating market structure
- Material reversal in institutional participation
- Valuation becoming disconnected from achievable earnings
The objective is not to defend an investment thesis. It is to continuously test it.
14. What the Waaree Case Taught Us About MGQI
The most important lesson is not that Waaree's earnings grew rapidly. It is that investment conviction developed progressively.
The sector opportunity created the starting point. M, G and Q strengthened the fundamental thesis. I added another layer of confirmation. Valuation compression improved the potential risk–reward. RS, Price and Volume helped assess when the market was confirming the thesis.
Uncertainty was managed through a probe position rather than an all-or-nothing decision.
That is the essence of MGQI.
15. The MGQI Decision Chain
DISCOVER — Assess the structural opportunity and evaluate the business through M, G, Q and I to determine whether it deserves consideration for ownership.
CONFIRM — Use Relative Strength, Price and Volume to assess whether market behaviour is confirming the opportunity and supports capital deployment.
ALLOCATE — Begin with a probe position when the evidence is compelling but still incomplete, and allow conviction to determine how much capital the opportunity should receive.
MONITOR — Reassess the business, market behaviour and portfolio role as evidence evolves; capital can increase, remain unchanged or be reduced when the evidence changes.
“The objective of MGQI is not to predict which stock will rise tomorrow. It is to identify businesses where the evidence is becoming increasingly compelling — and to deploy capital progressively as conviction earns the right to grow.”
Waaree Energies became interesting not because one factor looked attractive. It became interesting because sector opportunity, earnings momentum, growth, business quality, institutional participation, valuation and market behaviour increasingly converged.
The probe position was therefore not a bet on certainty. It was a measured commitment to a thesis that was still being tested.
Discover the opportunity. Confirm the evidence. Deploy progressively. Let conviction earn the capital.
Research Note
This case study illustrates the MGQI investment process and the evolution of an investment thesis. It is not a recommendation to buy or sell Waaree Energies. The financial, shareholding, valuation and market exhibits reflect the case-study dataset and supplied source material used in this analysis; readers should evaluate them against the latest available company disclosures and market data before making any investment decision.
The analytical charts in this document are derived directly from the financial and shareholding figures supplied for the case study. The technical and valuation exhibits are the original supplied screenshots and have not been reconstructed.